
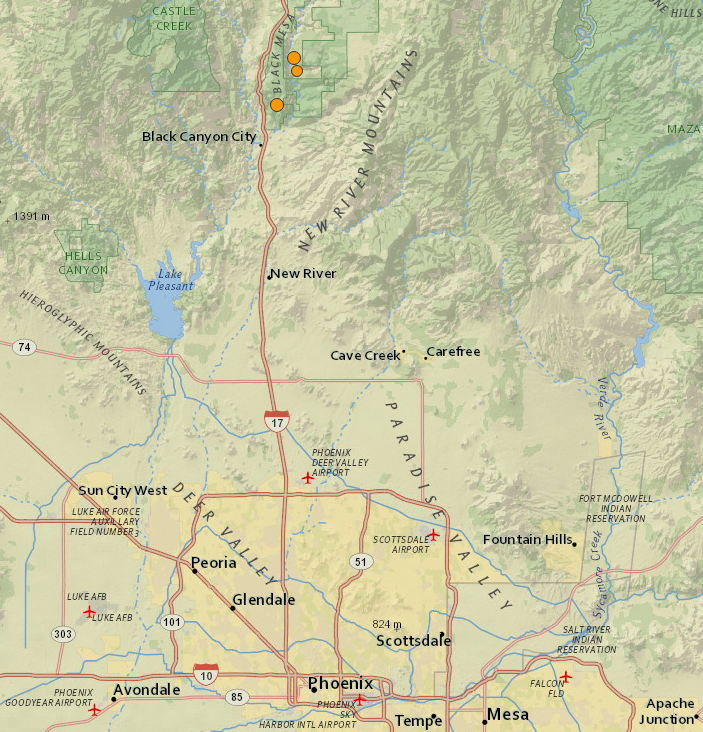
Three moderate-sized earthquakes shook central Arizona on the evening of November 1, 2015. All three occurred northeast of Black Canyon City, Arizona, along the Agua Fria River. The first earthquake was an ML 3.2 that occurred at 8:59 PM local time. The second earthquake was the largest, an Mb 4.1 (MW 4.0) that occurred at 11:29 PM local time. The last earthquake in the sequence as an ML 4 that occurred at 11:49 PM local time. The largest earthquake was felt in Phoenix, and the focal mechanism for this event indicates extensional fault movement associated with continuing Basin and Range crustal extension.
When geoscientists talk about the magnitude of an earthquake, they most often mean the moment magnitude, which is subtly different from the 'Richter magnitude' that you often hear reporters foolishly talk about. The moment magnitude (abbreviated MW) actually has physical meaning, as it calculated using seismic moment. The seismic moment is an expression of the amount of energy released during an earthquake. For the largest earthquake in the Black Canyon City sequence (the MW 4.0 event), the seismic moment was 1.384 x 10¹⁵ Nm (Newton-meters). Since 1 Newton-meter is the same as 1 Joule of energy, this value gives you an idea of how much energy was released during the earthquake. For reference, the amount of energy released during the test of the first nuclear device (the Trinity Test) was on the order of 1014 Joules. The amount of energy released just during our little earthquake in central Arizona was an order of magnitude larger! You can see that there is an absurd amount of energy involved in the whole earthquake thing. Of course, not all of this energy goes directly into acoustic (seismic) waves. Some of this energy is dissipated as heat, and some goes into inelastically deforming the surrounding rock.
You probably noticed that the magnitudes given above don't all say MW. There are a few other magnitude scales that geoscientists work with. One of these is called the body magnitude, denoted Mb. This is a magnitude that is based off of the amplitude of body waves, the seismic waves that propagate through the Earth (i.e., the P and S waves that you may have heard of before). Another is called the surface-wave magnitude, denoted Ms or Msw. This magnitude is based on the amplitude of surface waves. Since surface waves cause the motion that we feel at the Earth's surface, this value gives us the best idea for how much shaking (and therefore damage) an earthquake caused. Finally, there is the local magnitude, which is denoted ML. The local magnitude is generally determined from a scale that has been developed for earthquakes in a specific region. The classic 'Richter scale' is one such local magnitude scale. It was developed by Beno Gutenberg and Charles Richter at Caltech in the 1930s as a way to compare earthquakes recorded in Southern California on a specific type of seismometer (the Wood-Anderson torsion seismograph). Strictly speaking, the Richter magnitude scale only applies to Southern California. However, sometimes geoscientists will use it, or something similar, for other areas just to have a way to compare the relative sizes of different earthquakes in a specific area. In general, these magnitude scales are all quite similar for small- to moderate-sized earthquakes (those with MW less than about 6). So, in the case of the Black Canyon City earthquake sequence, we can use them more or less interchangeably to convey the sizes of the events.
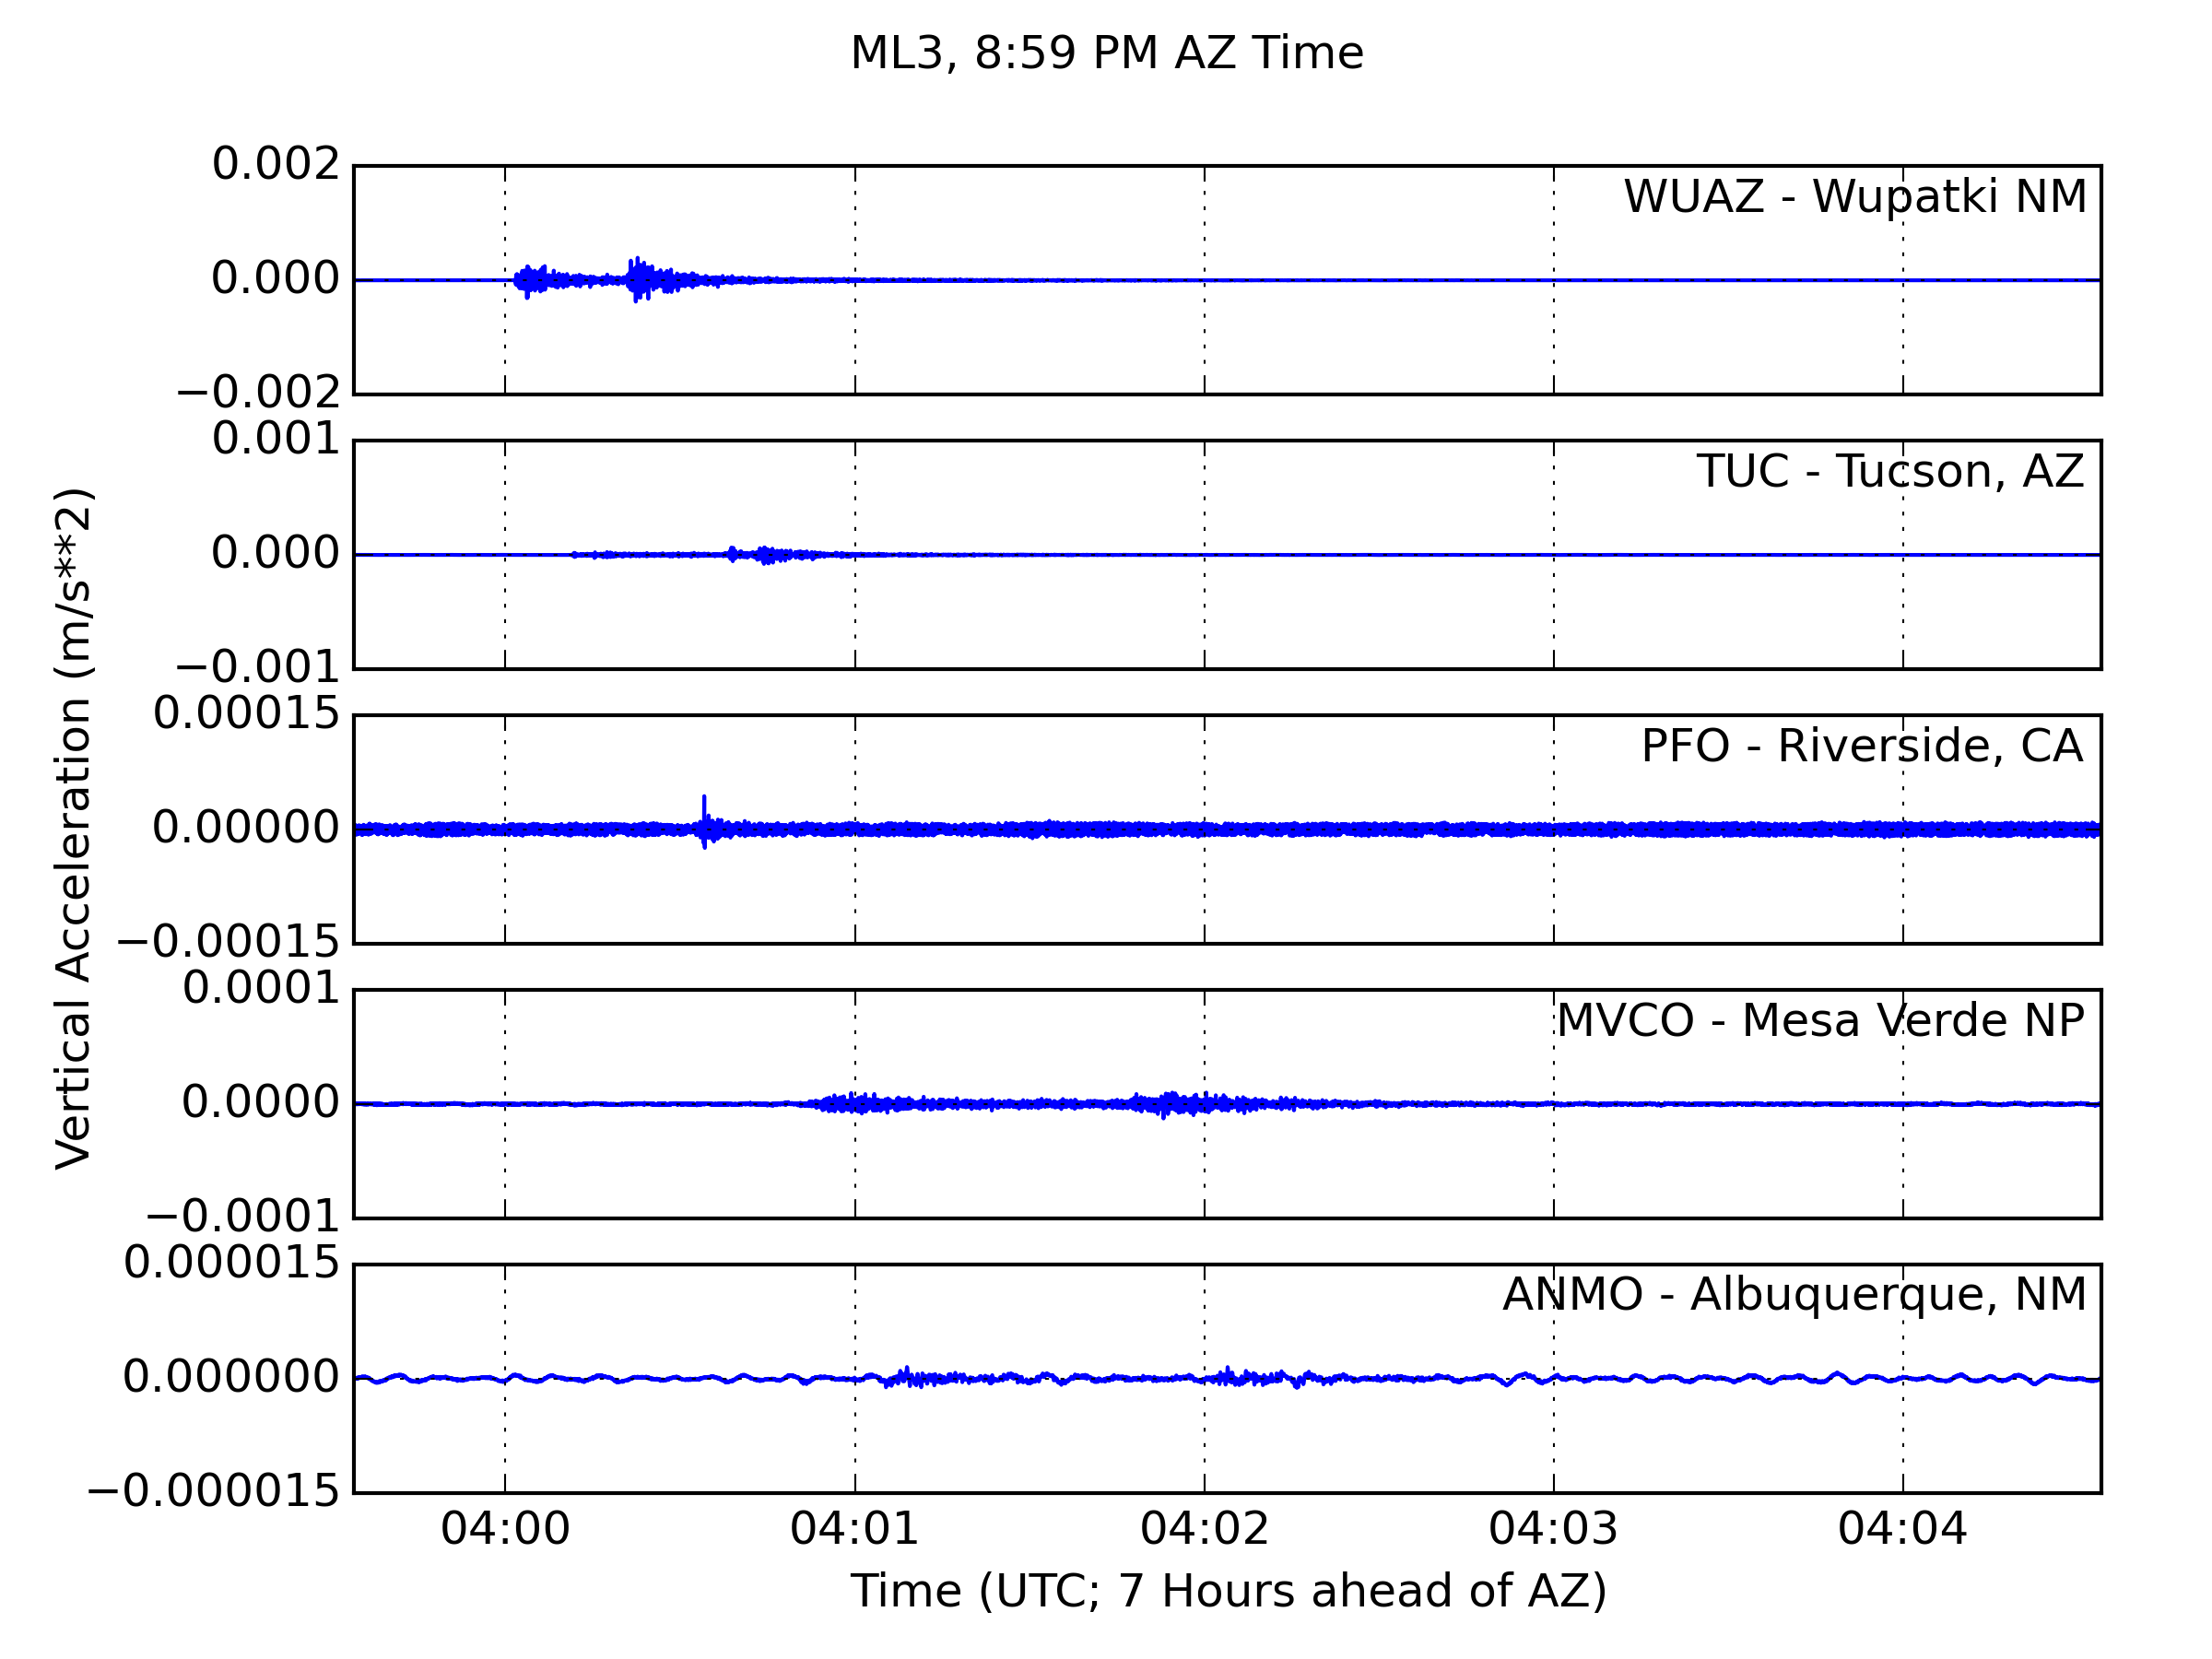
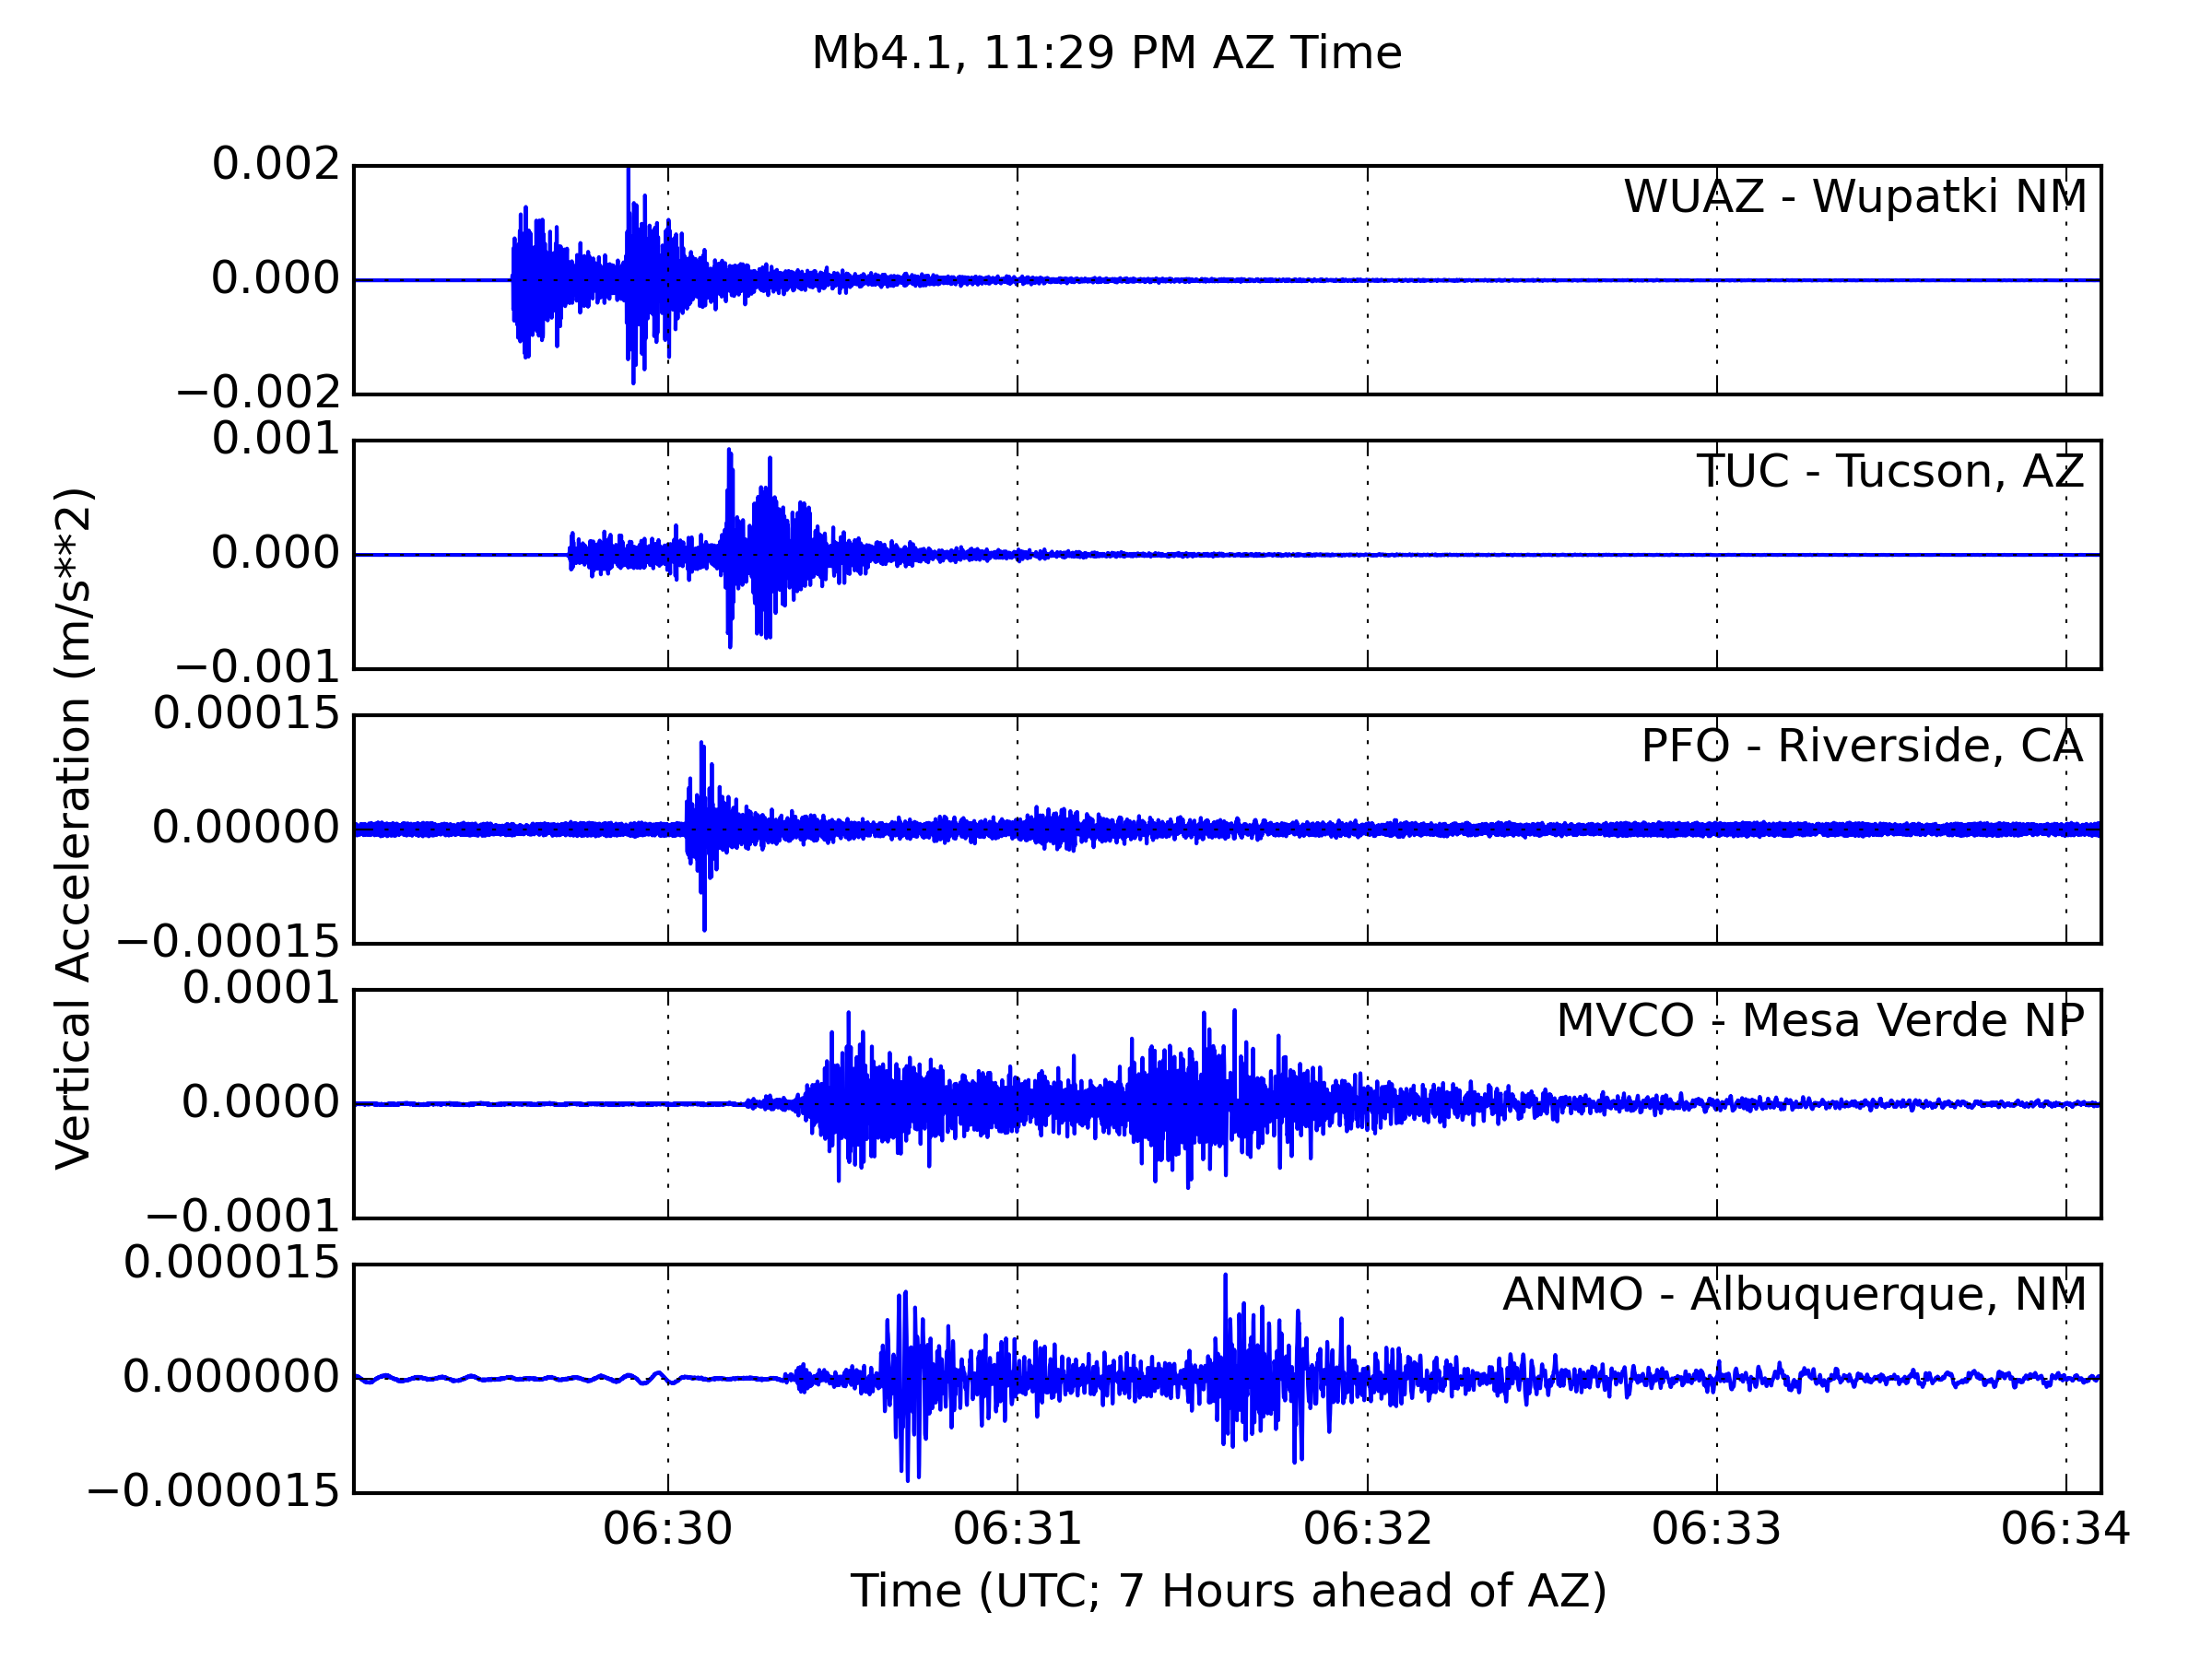
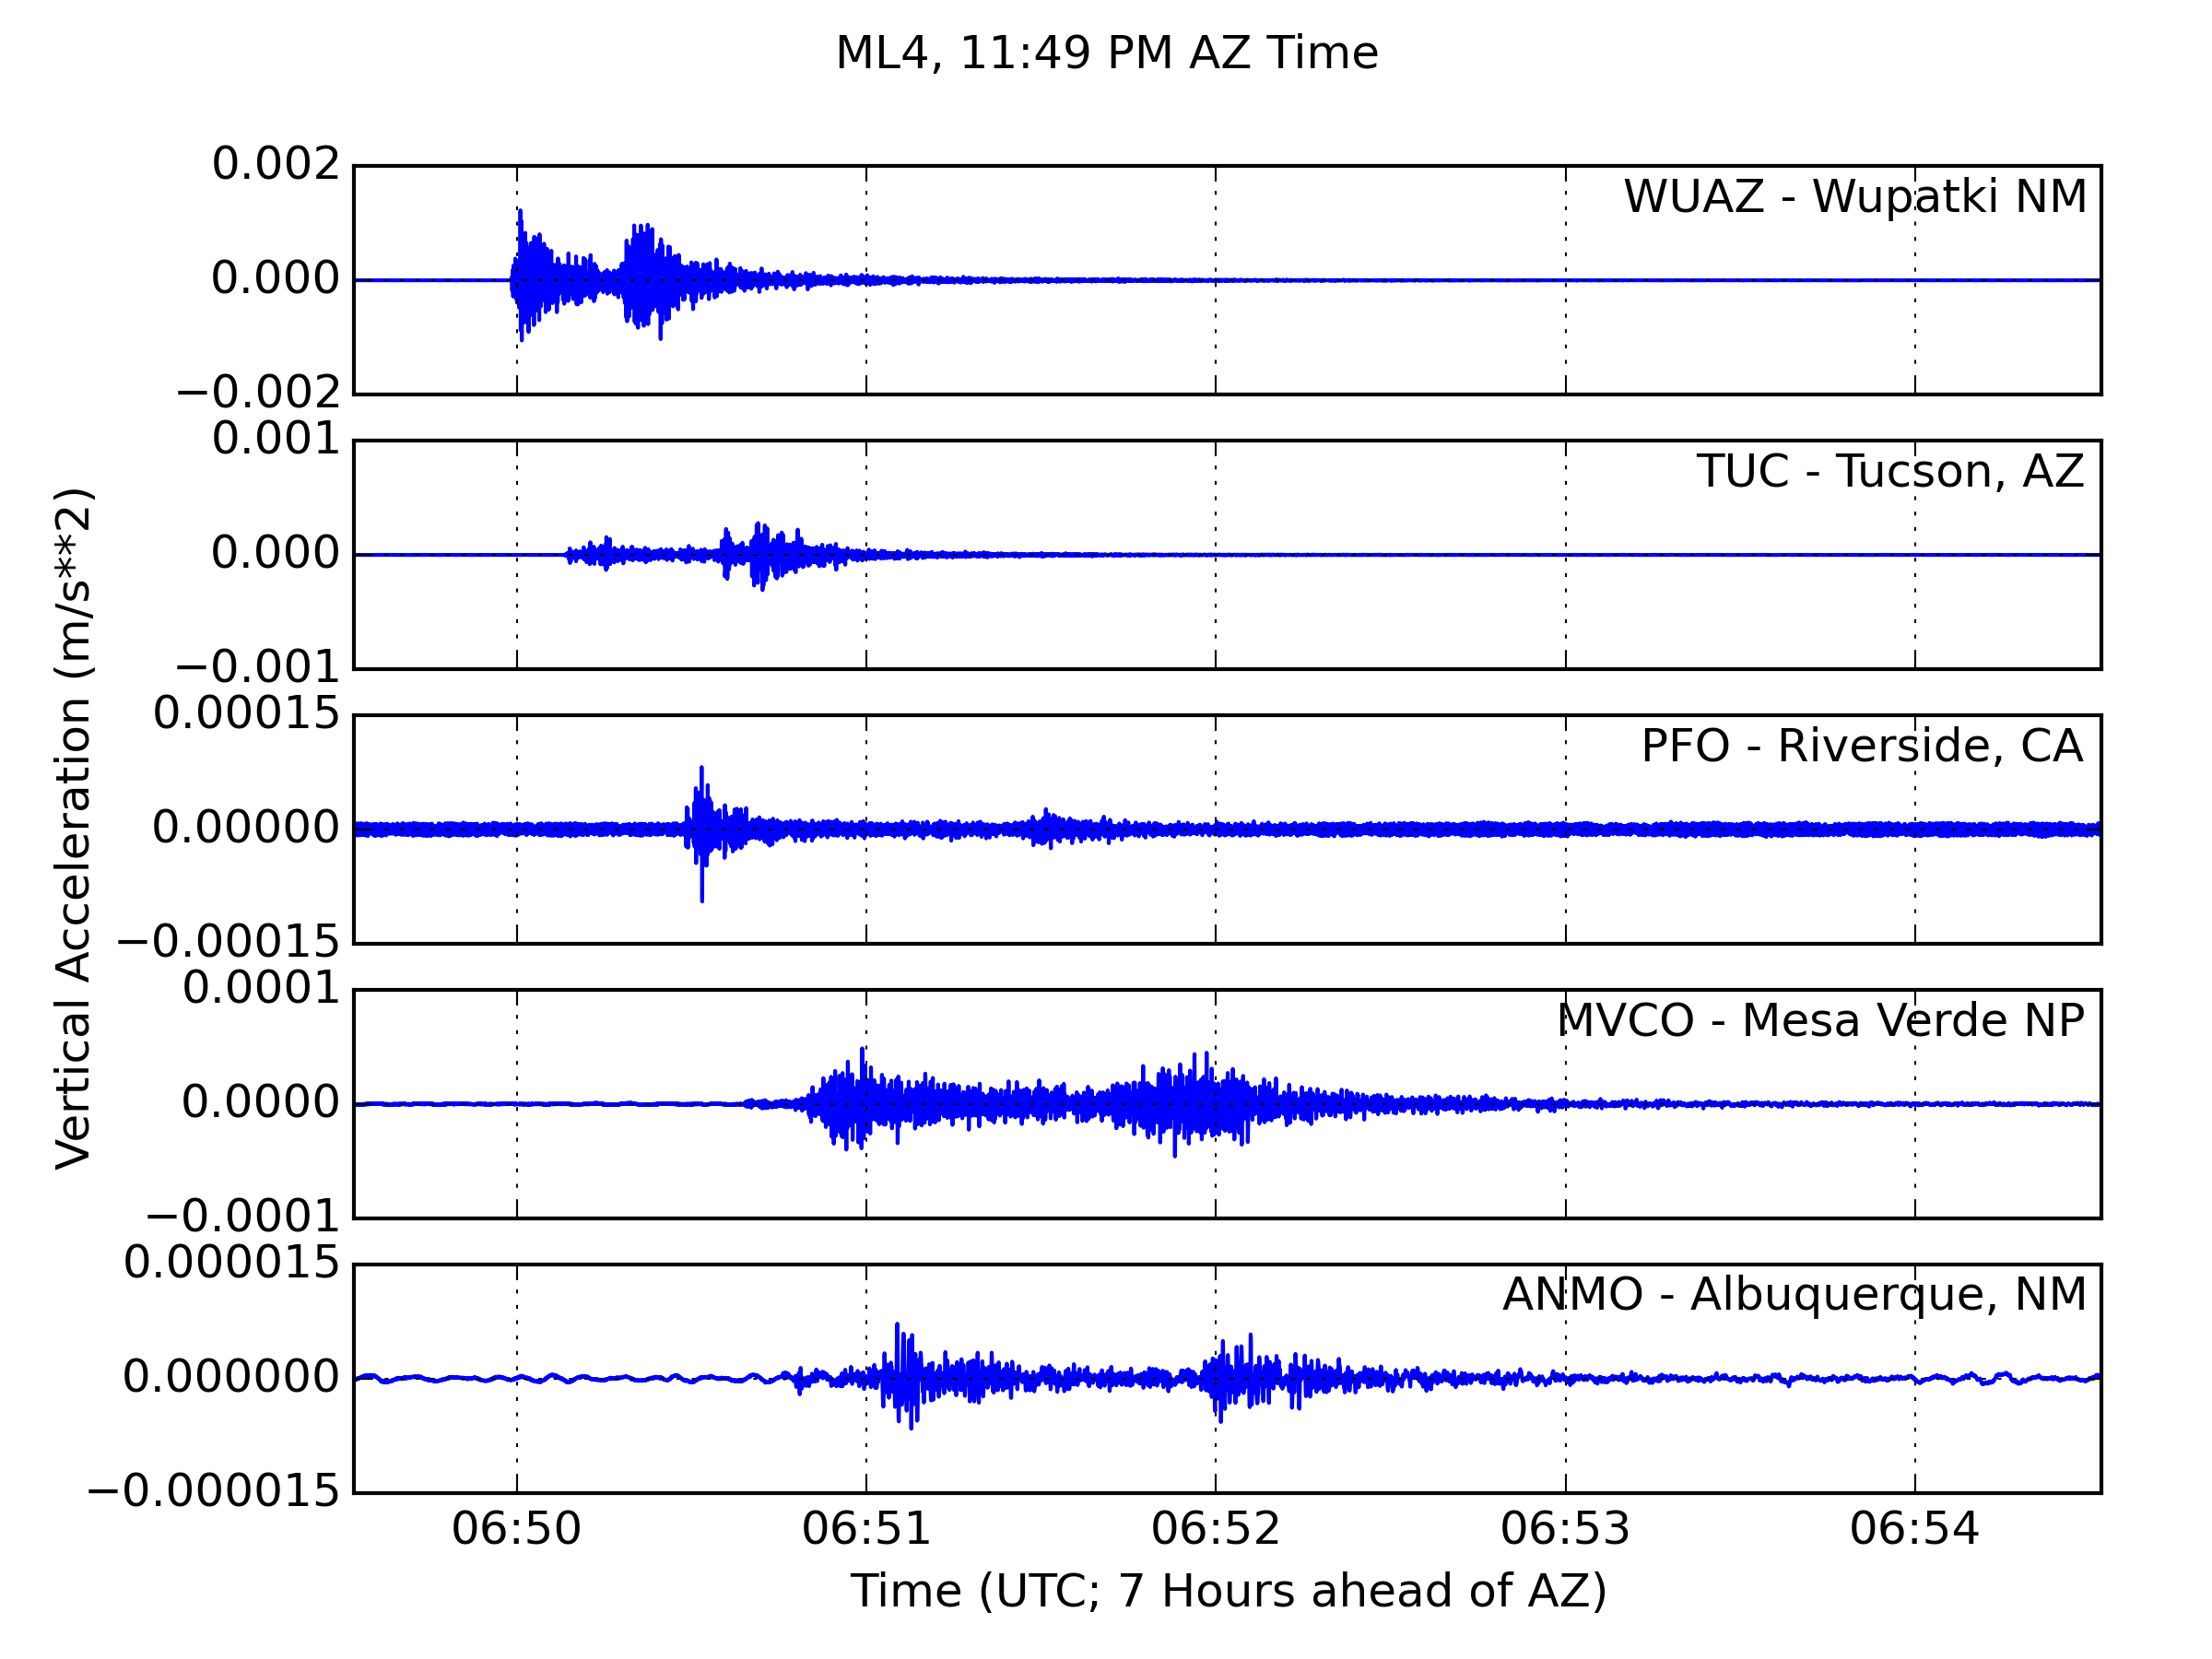
The above plots display the vertical ground acceleration recorded at a few major seismic stations in the Southwestern US. ('Vertical' here means perpendicular to the ground surface.) Each plot is for a different event in the earthquake sequence. I've kept the scale on corresponding seismograms the same in each plot, so you can see that the magnitude of ground motion was pretty different for each event. Since the amplitude of seismic waves decreases as you get further away from the earthquake location within the Earth (called the hypocenter), I've scaled the seismograms within each plot separately so that you can still see the measured ground acceleration at the farther stations. If I had kept all of the seismograms on the same scale, the plots would look something like this:
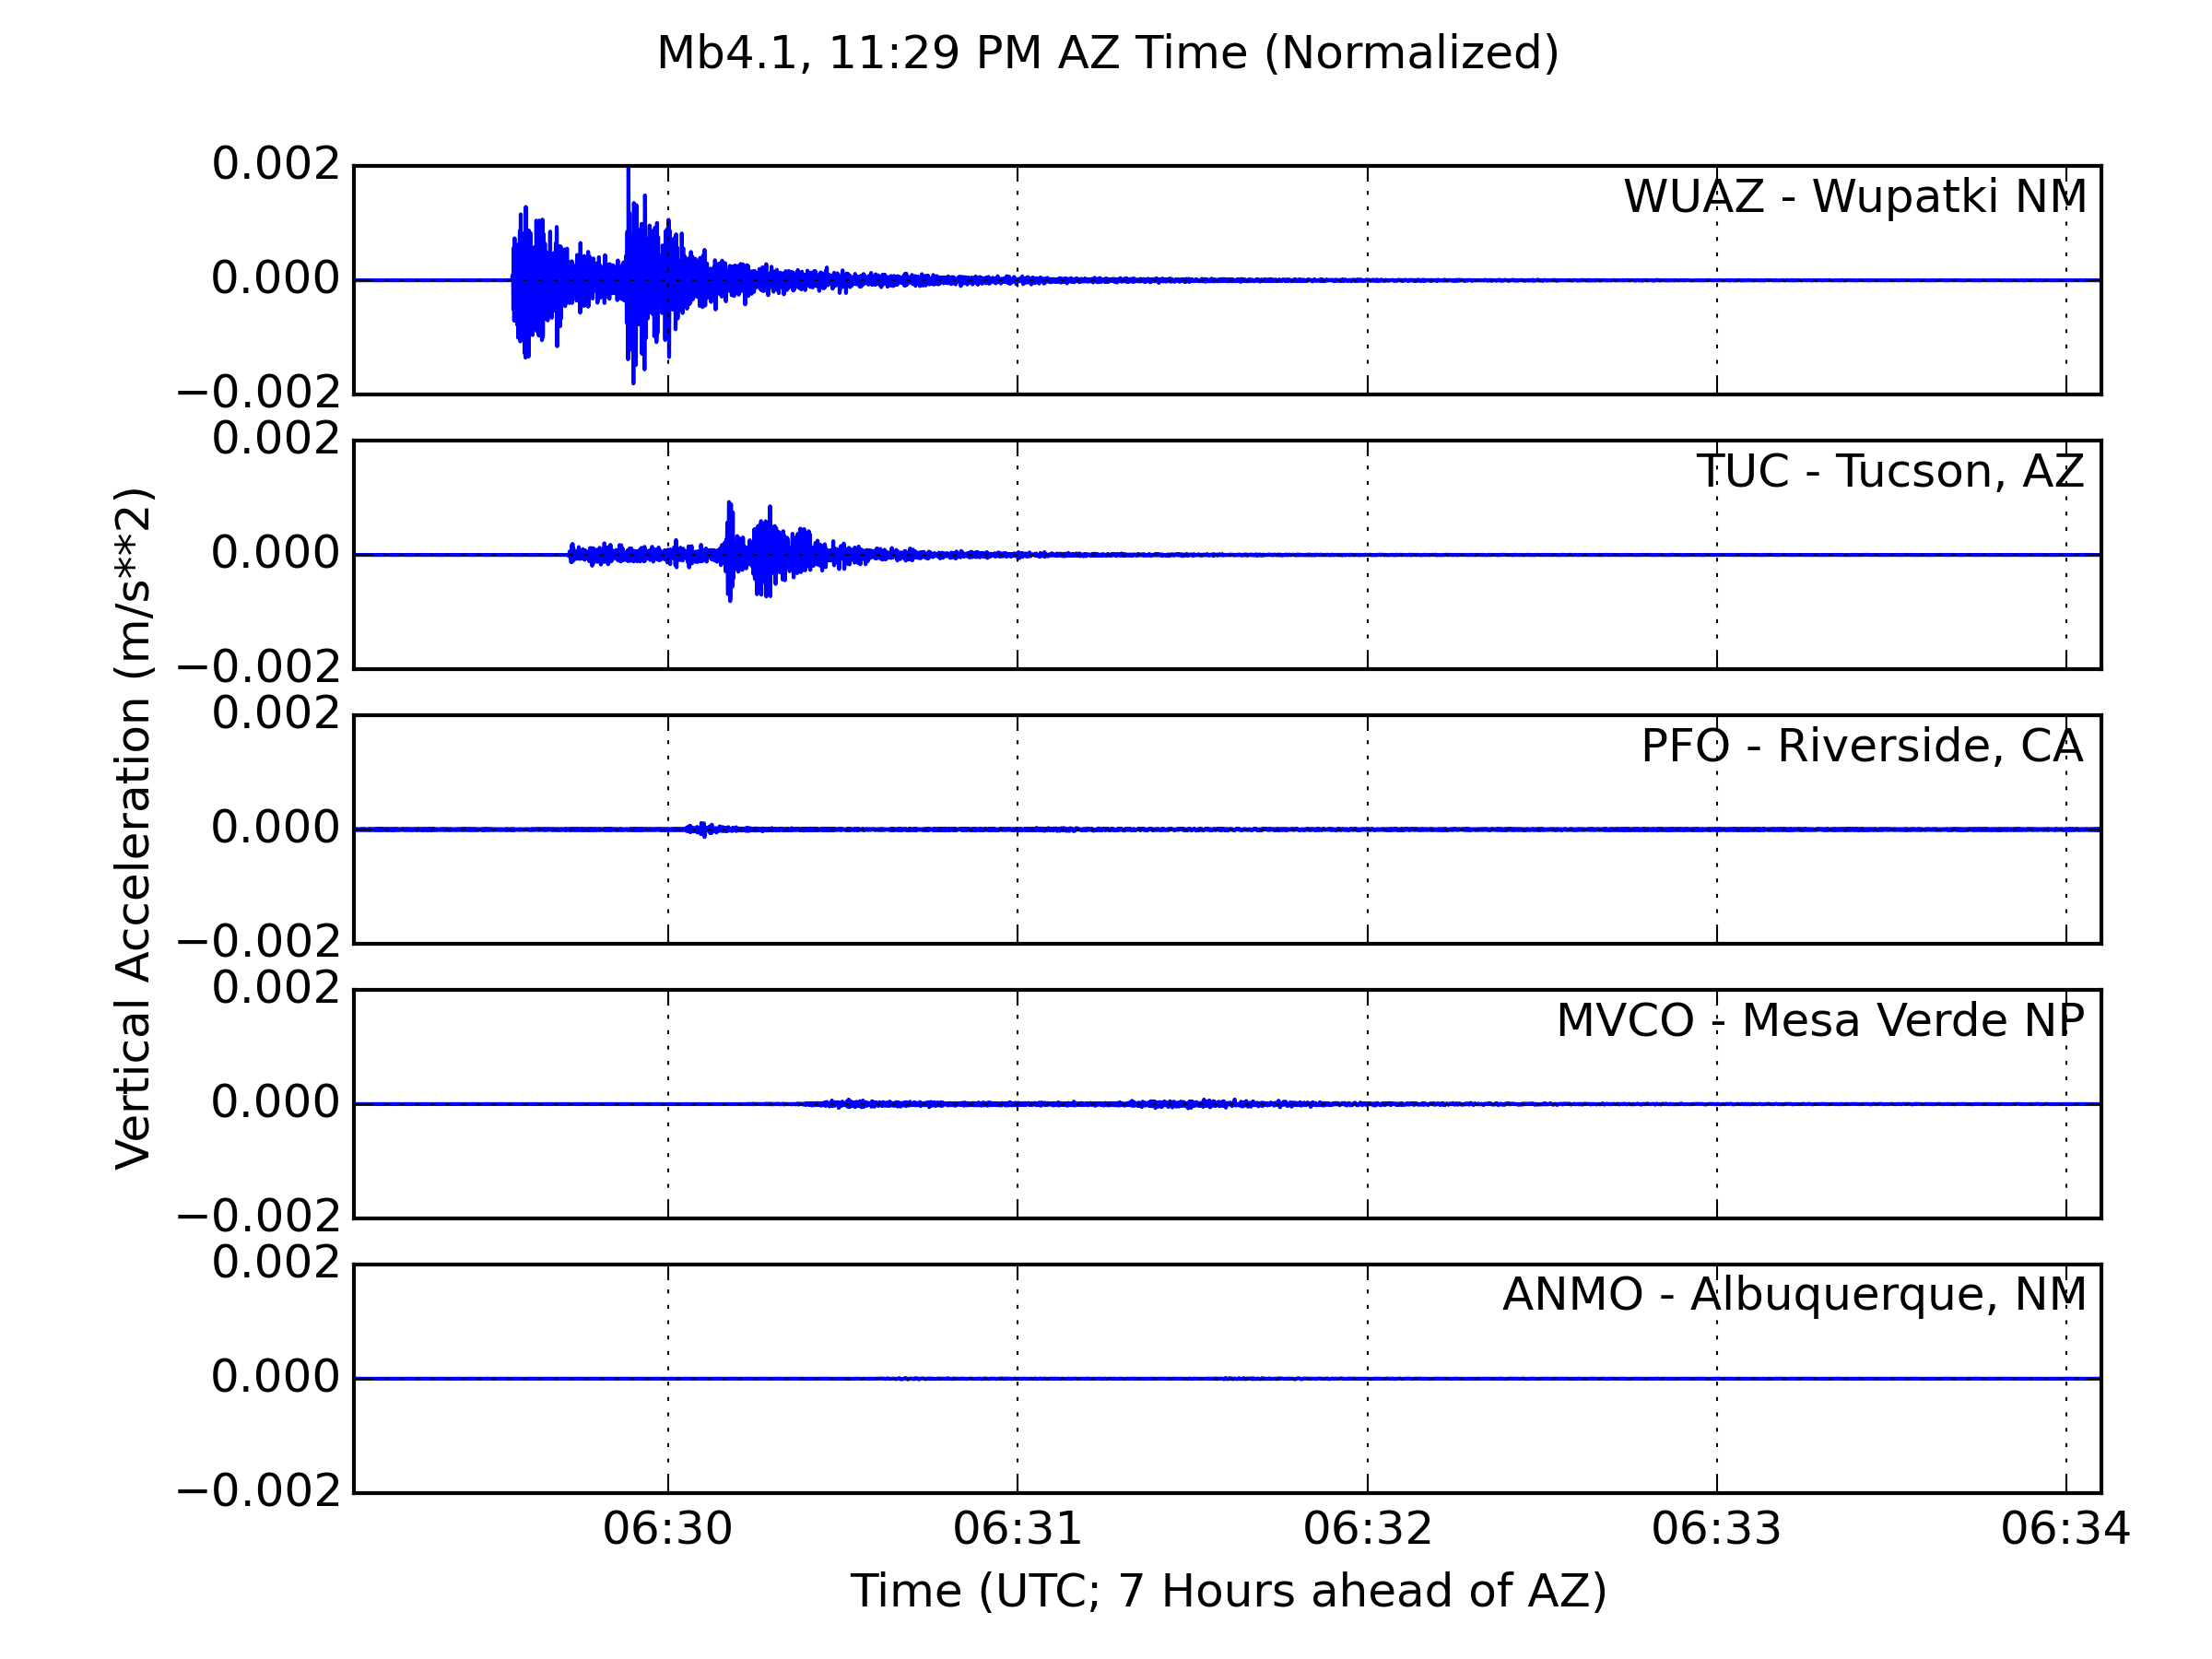
You can see that as we get farther from the earthquake hypocenter, the amplitude of ground motion decreases significantly.
So you're probably wondering why an earthquake like this happened in the middle of Arizona, since this region certainly doesn't see much seismicity. Arizona, like the entire Southwestern United States, has actually been undergoing major crustal extension over the past ~15 million years. Nevada, Utah, New Mexico, California, and Arizona have all been significantly stretched out to produce the Basin and Range topography that we see in this region today. The rate of extension in Arizona and New Mexico has slowed considerably, and therefore these states do not get as many earthquakes as Nevada, Utah, and Eastern California do. However, Arizona still is slowly extending.
Geoscientists often like to look at the focal mechanism for an earthquake, also called a beachball diagram, to understand how the earthquake actually happened. The USGS determined the focal mechanism for the largest of the Black Canyon City earthquakes; it is shown below.
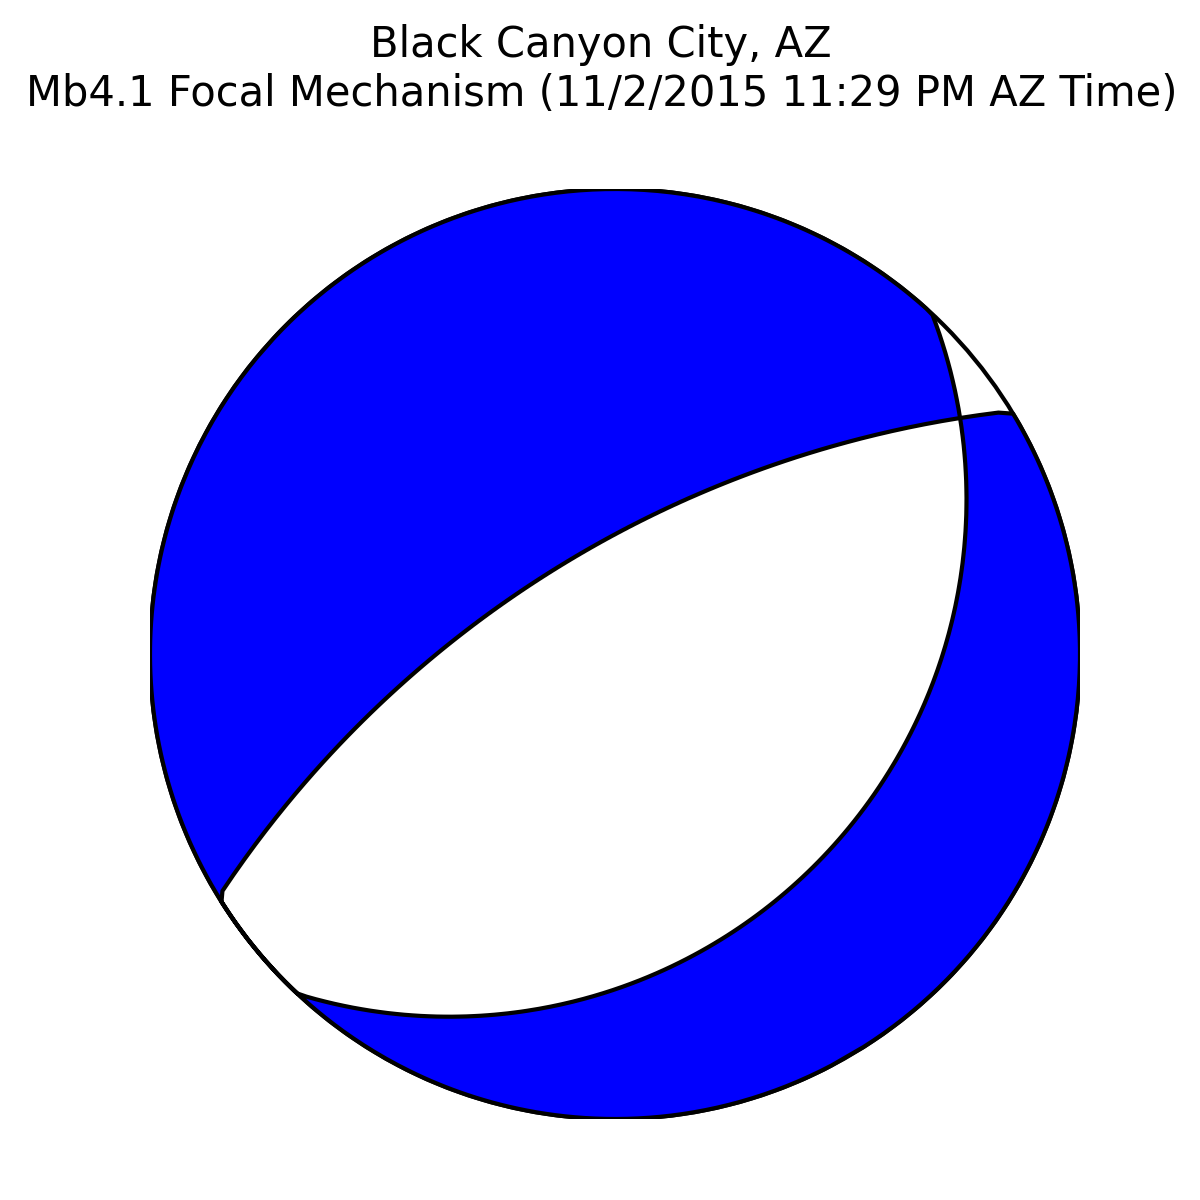
This image may look rather confusing (especially since it strongly resembles a beachball), but it conveys a rather simple idea. Essentially, the two curved lines within the circle represent two possible fault planes that could have caused this earthquake. (This is a lower-hemisphere stereoscopic projection, so we're looking at where the planes intersect the lower-half of a sphere.) The blue-shaded regions tell us the direction that the blocks bounding these possible fault planes could have moved. This focal mechanism diagram is characteristic of normal fault earthquakes, which are caused by extension of the crust. So, this earthquake sequence provides evidence that Arizona is continuing to be stretched out, albeit rather slowly. There are no mapped active faults at the Earth's surface above where these earthquakes occurred (called the epicenter), but the characteristics of the responsible fault(s) as determined from the focal mechanism are consistent with other known faults in the region.
It's interesting to note that these events occurred in the southern portion of the Arizona Transition Zone, not actually in the Arizona Basin and Range. The Transition Zone is a complicated boundary between the hyper-extended Basin and Range in Southern Arizona and the almost completely unextended Colorado Plateau in Northern Arizona. The Colorado Plateau has been stable for a very, very large portion of Earth's history, but now it is slowly getting eaten away by Basin and Range extension as well as volcanism. The Black Canyon City earthquake sequence shows that the Arizona Transition Zone is still being pulled apart, which implies that Basin and Range extension is continuing the tear northward into the Colorado Plateau. Someday, a very, very long time from now, much more of Arizona may look like the Basin and Range terrain of Southern Arizona and Nevada.
For more information on this earthquake sequence, check out the USGS earthquake summary for the largest event in the Black Canyon City earthquake sequence.
Back to Rocking with the Rocks